How Innovative Error Monitoring Solution Increased eCommerce Sales

About the Client
Our client is an advertising and development agency that provides highly effective e-commerce solutions. Their team consists of 80 people proficient in web design, product development, and advertising.
To enhance the online shopping experience for their clients, they decided to integrate a JavaScript automatic error monitoring tool into their workflow. This was a challenging project, so they opted to expand their team with additional experts from Logik Labs.
Business Challenges
Testing the functionality of a web application is essential even during the development lifecycle. However, after an app is live and accessible for users, testing continues. Although we might believe the app runs flawlessly, there is always room for improvement. What we never want is for these errors to be discovered by end users.
Many companies, including our client, turn to customized solutions capable of detecting errors automatically as soon as they appear. Popular error-tracking tools from the market did not fulfill our client’s needs. Thus, they reached out to us hoping to get a custom solution suitable for their specific challenges.
The main goal was to make web applications accessible to users 24/7, even when the process of identifying and fixing errors occurs in the background.
These were the technical requirements:
- Tracking errors that arise within an application.
- Providing a detailed overview of all incoming errors.
- Gathering, organizing, and prioritizing errors, while focusing on resolving the most crucial issues first.
- Displaying URLs and the number of users affected by a specific error.
- Highlighting the lines of code responsible for triggering errors.
Being able to catch the latest errors gives enough time for our client’s team to resolve them without impacting an app’s performance.

Solutions and Values We Delivered
The first phase of the project was creating a control dashboard. It is a central page where all errors are gathered, sorted, and resolved. There is no need to use multiple tools; everything necessary for error tracing and debugging is available in one place. Instead of sorting errors by hand, developers can relax because the system does it for them. Our smart ranking system analyzes all incoming errors and notifies developers which ones need fixing first.
To assist developers in debugging an app while it runs, we implemented the stack tracing feature. For those unfamiliar with the feature, it allows developers to step-by-step trace how functions call each other and execute their code. When they reach the function containing the error, they see the exact line of code causing the issue.
Read the text below to explore the basic components of our application.
Figuring Out What is Wrong
Before integrating our application into the client’s workflow, their developers had to rely on a combination of tools to solve specific issues. While some used browser consoles, others relied on code editors and various external tools. This workflow was unsustainable in the long run.
With our solution, everything changes. The starting point for resolving errors is opening the control dashboard. Once accessed, administrators and software engineers gain insight into all errors occurring in a web application.
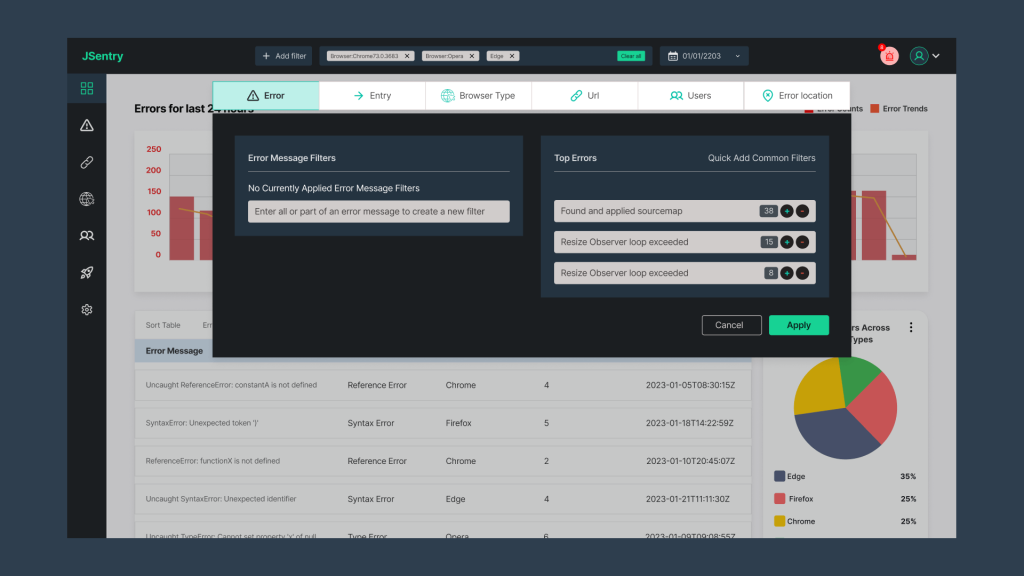
Errors are displayed in a table with the following columns:
- Error message.
- Error type.
- Browser type.
- Occurrence count.
- Last occurrence date.
Additionally, users can expand each error to see additional information, such as browser type, device type, and stack trace with highlighted code.
One of the most significant functionalities is the smart impact ranking system, classifying errors from less to most critical. For example, when a programmer visits this section, they can see a list of issues, with the most urgent ones displayed at the top. To understand the urgency in resolving a particular error, there are additional pieces of information:
- How many users are affected by the error?
- Which webshops, pages, and subpages are affected?

Stack Tracing and Debugging
What is the difference between these terms? The stack trace provides a chronological sequence of the functions and methods that have been called leading up to the error, giving a clear picture of the error’s origin. Debugging, on the other hand, involves code fixing and making sure a specific web feature works properly.
Our software provides developers with a stack trace report that includes code snippets highlighting the lines of code where the error occurred. This gives them the ability to react fast and resolve the most critical errors.
Not only does this help save time, but it also provides more accuracy in bug fixing. Traditional stack trace reports are confusing, with a lot of information to observe. Our software’s stack trace report simplifies the process, presenting the information clearly and concisely.
Browsing Without Interruptions
Here we have two key entities – developers and end users. To deliver high-quality software solutions, developers must have effective tools for error detection. On the other hand, to ensure a great user experience, users should be able to access a website smoothly and without interruptions.
To meet the needs of both parties, we implemented the Downtime monitoring feature into the application. Developers can focus on their work without worrying about an app’s functioning, while users can access the website without interruptions.
Downtime monitoring is essential as it tracks the website in real-time and sends notifications in case of any issues. There are even more benefits of it:
- Minimizing website downtime.
- Elevating user experience.
- Providing detailed information about the nature of the issue and the time it occurred.
- Preventing similar problems from happening in the future.
Benefits
Debugging Time Reduced by 40%
With detailed error reports and stack traces, the client’s team has achieved a 40% reduction in debugging time. The software has proven to be the right choice as their team members now have additional time to spend on other crucial tasks essential for the business’s growth.
The Error Rate Dropped from 10% to 3%
After several months of using our solution, the client’s team reported a significant decrease in the error rate – a remarkable drop from an initial 10% down to an impressive 3%. Websites operate smoothly, with users’ actions generating significantly fewer errors.
Conclusion
Enhancing user experience is challenging because tech-savvy users can easily spot errors with just a few mouse clicks. Our client did not want end users to encounter “red alerts” popping up in their browser consoles. Instead, they wished to collect and resolve these issues as soon as possible.
However, it is worth mentioning that achieving 100% bug-free software is unrealistic. Every program has hidden issues that may manifest under specific circumstances. Therefore, when thousands of users interact with a website’s elements, there is a high chance of triggering errors.